This tool helps participants identify key stakeholders, their connections, and the structure of the network, supporting better planning and collaboration.
- Drawing the Actors:
Ask participants to identify and draw all relevant actors (individuals, organisations, groups) involved in a specific space or collaboration. This can be done on a whiteboard, large sheet of paper, or wall using cards, sticky notes, and markers.
- Positioning the Actors:
Participants must agree on the placement of each actor according to a chosen structure. For example, actors can be arranged in a Venn diagram, stakeholder map, or spider diagram, depending on the relationships and context.
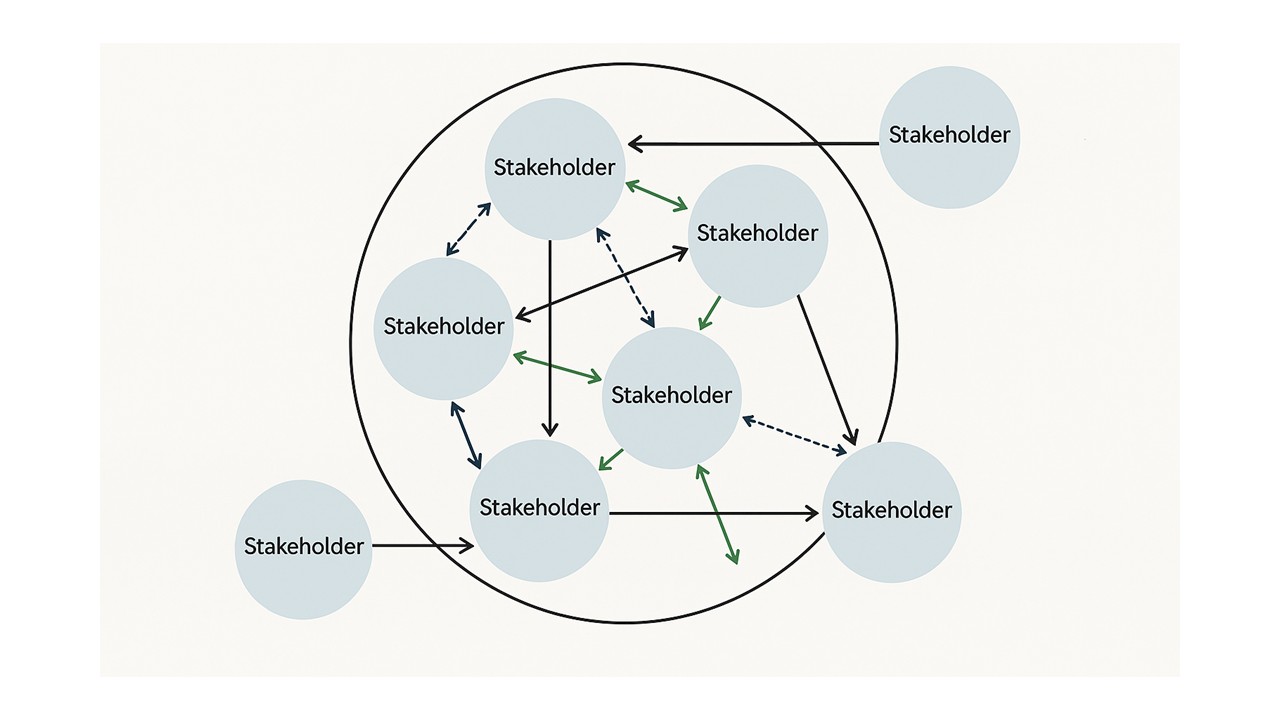
- Mapping Relationships:
Use arrows to indicate relationships between actors.
- Intermittent arrows can represent weak connections.
- Thick arrows can indicate strong connections.
- Arrows may be bidirectional.
- Different colours can be used to signify various types of relationships (e.g., collaboration, funding, communication).
- Inner and Outer Circles:
The diagram can be extended with inner and outer circles:
- Stakeholders who are present and active are placed in the inner circle.
- Those who are not (but should be) are located in the outer circle.
- Creative Identification:
The facilitator can encourage creativity in identifying stakeholders, exploring desired characteristics or roles as needed for the intervention.
Tips:
- Encourage open discussion and consensus on the placement and relationships of stakeholders.
- Use the map as a living document—update it as new actors or relationships emerge.
- The visual output can be photographed or digitised for future reference.
Benefits:
- Provides a clear, shared overview of the stakeholder landscape.
- Highlights key connections, gaps, and potential subgroups.
- Supports strategic planning and targeted engagement.